The Most Expensive Views in the World 2019
In almost every major city worldwide, there are countless towers, hotels, and attractions with skyline views worth every penny. But which stunning panoramas are the most expensive? TicketLens has uncovered the tallest monuments around the world with observation decks and identifi

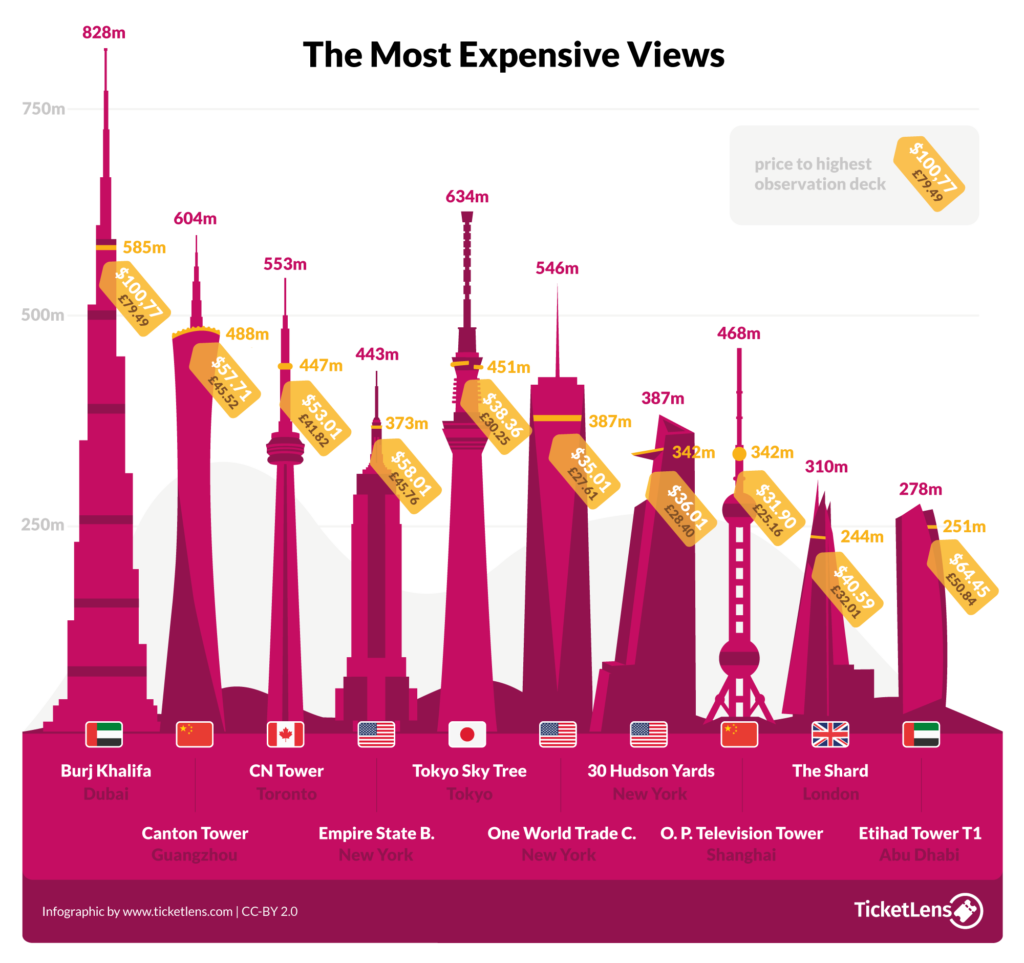
In almost every major city worldwide, there are countless towers, hotels, and attractions with skyline views worth every penny. But which stunning panoramas are the most expensive? TicketLens has uncovered the tallest monuments around the world with observation decks and identified their admission costs. The study also includes a breakdown of the cost per meter of height from the ground to the tallest observation deck, helping sightseers live the high-life without breaking the bank.
With a height of 828 metres, the Burj Khalifa in Dubai is the tallest building in the world. The skyscraper, with an entrance price of £79.49/$100.77, is a symbol of affluence and luxury. However, the Etihad Towers T1 in Abu Dhabi has the most expensive viewing platform relative to the height at £0.20/$0.26 per metre - compared to £0.14/$0.17 for the Burj Khalifa. The Eiffel Tower in Paris, the Berlin TV Tower, the Donauturm in Vienna, and the Stratosphere Tower in Las Vegas, all offer skyline views for just £0.08/$0.10 per meter - with the Eiffel Tower boasting the highest observation deck of the four - at 276 meters high.
Rank | Name monument name
Height architectural height | Deck Height of the highest observation deck | Price
$/m average price per meter (height observation deck)
City | Country | Year of completion | Score
| Rank | Name | Height | Deck | $ Price | $/m | £ Price | £/m | City | Country | Year | Score |
|---|---|---|---|---|---|---|---|---|---|---|---|
| 1 | Burj Khalifa | 828m | 585m | $100.77 | $0.17 | £79.49 | £0.14 | Dubai | UAE | 2010 | 9,92 |
| 2 | Canton Tower | 604m | 488m | $57.71 | $0.12 | £45.52 | £0.09 | Guangzhou | China | 2010 | 9,35 |
| 3 | CN Tower | 553m | 447m | $53.01 | $0.12 | £41.82 | £0.09 | Toronto | Canada | 1976 | 9,23 |
| 4 | Empire State Building | 443m | 373m | $58.01 | $0.16 | £45.76 | £0.12 | New York | USA | 1931 | 9,17 |
| 5 | Tokyo Skytree | 634m | 451m | $38.36 | $0.09 | £30.25 | £0.07 | Tokyo | Japan | 2012 | 8,63 |
| 6 | One World Trade Center | 546m | 387m | $35.01 | $0.09 | £27.61 | £0.07 | New York | USA | 2014 | 8,52 |
| 7 | 30 Hudson Yards | 387m | 342m | $36.01 | $0.11 | £28.40 | £0.08 | New York | USA | 2019 | 8,32 |
| 8 | Oriental Pearl Television Tower | 468m | 342m | $31.90 | $0.09 | £25.16 | £0.07 | Shanghai | China | 1995 | 8,31 |
| 9 | The Shard | 310m | 244m | $40.59 | $0.17 | £32.01 | £0.13 | London | UK | 2013 | 8,21 |
| 10 | Etihad Towers T1 | 278m | 251m | $64.45 | $0.26 | £50.84 | £0.20 | Abu Dhabi | UAE | 2011 | 7,99 |
| 11 | KK100 | 442m | 427m | $33.00 | $0.08 | £26.03 | £0.06 | Shenzhen | China | 2011 | 7,77 |
| 12 | King Power MahaNakhon | 320m | 310m | $32.99 | $0.11 | £26.02 | £0.08 | Bangkok | Thailand | 2016 | 7,74 |
| 13 | Stratosphere Tower | 350m | 266m | $27.50 | $0.10 | £21.70 | £0.08 | Las Vegas | USA | 1996 | 7,63 |
| 14 | Rockefeller Center | 259m | 256m | $41.38 | $0.16 | £32.64 | £0.13 | New York | USA | 1933 | 7,44 |
| 15 | Eiffel Tower | 324m | 276m | $28.55 | $0.10 | £22.52 | £0.08 | Paris | France | 1889 | 7,43 |
| 16 | Ping An Finance Centre | 599m | 562m | $29.00 | $0.05 | £22.88 | £0.04 | Shenzhen | China | 2017 | 7,34 |
| 17 | International Commerce Centre | 484m | 388m | $23.96 | $0.06 | £18.90 | £0.05 | Hong Kong | China | 2010 | 7,23 |
| 18 | Berlin TV Tower | 368m | 204m | $21.27 | $0.10 | £16.78 | £0.08 | Berlin | Germany | 1969 | 7,20 |
| 19 | Menara Kuala Lumpur | 420m | 300m | $23.65 | $0.08 | £18.66 | £0.06 | Kuala Lumpur | Malaysia | 1996 | 7,13 |
| 20 | China World Tower | 330m | 312m | $27.00 | $0.09 | £21.30 | £0.07 | Beijing | China | 2010 | 7,11 |
| 21 | 875 North Michigan Avenue | 457m | 314m | $22.01 | $0.07 | £17.36 | £0.06 | Chicago | USA | 1969 | 7,10 |
| 22 | Shanghai World Financial Center | 494m | 474m | $26.10 | $0.06 | £20.59 | £0.04 | Shanghai | China | 2008 | 7,09 |
| 23 | Overseas Union Bank Centre | 278m | 276m | $29.09 | $0.11 | £22.95 | £0.08 | Singapore | Singapore | 1986 | 7,05 |
| 24 | Shanghai Tower | 632m | 562m | $26.10 | $0.05 | £20.59 | £0.04 | Shanghai | China | 2015 | 7,02 |
| 25 | Tashkent Tower | 375m | 97m | $14.14 | $0.15 | £11.16 | £0.11 | Tashkent | Uzbekistan | 1985 | 7,01 |
| 26 | Willis Tower | 442m | 412m | $25.01 | $0.06 | £19.72 | £0.05 | Chicago | USA | 1974 | 6,99 |
| 27 | Observation Tower at Olympic Park | 258m | 228m | $29.00 | $0.13 | £22.88 | £0.10 | Beijing | China | 2014 | 6,90 |
| 28 | Etihad Towers T2 | 305m | 282m | $25.87 | $0.09 | £20.41 | £0.07 | Abu Dhabi | UAE | 2011 | 6,83 |
| 29 | Sky Tower | 328m | 217m | $20.93 | $0.10 | £16.51 | £0.08 | Auckland | New Zealand | 1997 | 6,69 |
| 30 | Macau Tower | 338m | 233m | $20.41 | $0.09 | £16.10 | £0.07 | Macau | China | 2001 | 6,68 |
| 31 | Tianjin World Financial Center | 337m | 314m | $22.49 | $0.07 | £17.74 | £0.06 | Tianjin | China | 2011 | 6,54 |
| 32 | Petronas Twin Towers | 452m | 360m | $19.12 | $0.05 | £15.08 | £0.04 | Kuala Lumpur | Malaysia | 1998 | 6,34 |
| 33 | Lotte World Tower | 556m | 498m | $21.53 | $0.04 | £16.98 | £0.03 | Seoul | South Korea | 2017 | 6,34 |
| 34 | Taipei 101 | 508m | 392m | $19.08 | $0.05 | £15.05 | £0.04 | Taipei | Taiwan | 2004 | 6,27 |
| 35 | Torre Costanera | 300m | 261m | $21.50 | $0.08 | £16.96 | £0.06 | Santiago | Chile | 2014 | 6,20 |
| 36 | Columbia Center | 284m | 275m | $22.01 | $0.08 | £17.36 | £0.06 | Seattle | USA | 1984 | 6,08 |
| 37 | Q1 | 323m | 235m | $18.67 | $0.08 | £14.73 | £0.06 | Gold Coast (Australia) | Australia | 2005 | 6,06 |
| 38 | Kingdom Centre | 302m | 290m | $21.34 | $0.07 | £16.83 | £0.06 | Riyadh | Saudi Arabia | 2002 | 5,99 |
| 39 | Federation Tower | 374m | 327m | $18.63 | $0.06 | £14.70 | £0.04 | Moscow | Russia | 2016 | 5,93 |
| 40 | Talinn TV Tower | 312m | 170m | $14.55 | $0.09 | £11.48 | £0.07 | Talinn | Estonia | 1980 | 5,93 |
| 41 | Jin Mao Tower | 421m | 340m | $17.47 | $0.05 | £13.94 | £0.04 | Shanghai | China | 1999 | 5,90 |
| 42 | Ostankino Tower | 540m | 337m | $15.53 | $0.05 | £12.25 | £0.04 | Moscow | Russia | 1967 | 5,85 |
| 43 | Henan Province Radio & TV Tower | 388m | 256m | $14.21 | $0.06 | £11.21 | £0.04 | Zhengzhou | China | 2011 | 5,71 |
| 44 | Eurasia Tower | 309m | 307m | $18.63 | $0.06 | £14.69 | £0.05 | Moscow | Russia | 2015 | 5,48 |
| 45 | Donauturm | 252m | 165m | $16.23 | $0.10 | £12.80 | £0.08 | Vienna | Austria | 1964 | 5,40 |
| 46 | Central Radio & TV Tower | 405m | 262m | $13.05 | $0.05 | £10.29 | £0.04 | Beijing | China | 1992 | 5,37 |
| 47 | Zifeng Tower | 450m | 272m | $11.60 | $0.04 | £9.15 | £0.03 | Nanjing | China | 2010 | 5,10 |
| 48 | Eureka Tower | 297m | 282m | $15.91 | $0.06 | £12.55 | £0.04 | Melbourne | Australia | 2006 | 5,06 |
| 49 | Qingdao TV Tower | 232m | 116m | $14.50 | $0.13 | £11.44 | £0.10 | Qingdao | China | 2001 | 5,06 |
| 50 | Sydney Tower Eye | 309m | 250m | $13.14 | $0.05 | £10.37 | £0.04 | Sydney | Australia | 1981 | 4,81 |
| 51 | Shun Hing Square | 384m | 298m | $11.60 | $0.04 | £9.15 | £0.03 | Shenzhen | China | 1996 | 4,60 |
| 52 | Abeno Harukas | 300m | 288m | $13.70 | $0.05 | £10.80 | £0.04 | Osaka | Japan | 2014 | 4,54 |
| 53 | Tianjin Radio & TV Tower | 415m | 257m | $7.25 | $0.03 | £5.72 | £0.02 | Tianjin | China | 1991 | 3,94 |
| 54 | Europaturm | 337m | 222m | $8.40 | $0.04 | £6.62 | £0.03 | Frankfurt | Germany | 1979 | 3,94 |
| 55 | Riga TV Tower | 368m | 97m | $4.14 | $0.04 | £3.27 | £0.03 | Riga | Latvia | 1987 | 3,84 |
| 56 | Olympiaturm | 291m | 192m | $8.62 | $0.04 | £6.80 | £0.04 | München | Germany | 1968 | 3,79 |
| 57 | Tokyo Tower | 333m | 250m | $8.22 | $0.03 | £6.48 | £0.03 | Tokyo | Japan | 1958 | 3,72 |
| 58 | Keangnam Hanoi Landmark Tower | 349m | 310m | $7.70 | $0.02 | £6.07 | £0.02 | Hanoi | Vietnam | 2012 | 3,63 |
| 59 | Fernsehturm | 217m | 150m | $10.08 | $0.07 | £7.95 | £0.05 | Stuttgart | Germany | 1969 | 3,56 |
| 60 | Bitexco Financial Tower | 264m | 182m | $8.56 | $0.05 | £6.75 | £0.04 | Ho Chi Minh City | Vietnam | 2010 | 3,49 |
| 61 | Landmark Tower | 296m | 273m | $9.13 | $0.03 | £7.20 | £0.03 | Yokohama | Japan | 1993 | 3,45 |
| 62 | N Seoul Tower | 237m | 136m | $8.44 | $0.06 | £6.66 | £0.05 | Seoul | South Korea | 1975 | 3,44 |
| 63 | Milad Telecom Tower | 435m | 302m | $0.23 | $0.00 | £0.18 | £0.00 | Tehran | Iran | 2009 | 3,38 |
| 64 | Sunshine 60 Tower | 240m | 222m | $10.96 | $0.05 | £8.64 | £0.04 | Tokyo | Japan | 1978 | 3,34 |
| 65 | 85 Sky Tower | 378m | 341m | $3.18 | $0.01 | £2.51 | £0.01 | Kaohsiung (Taiwan) | Taiwan | 1997 | 3,27 |
| 66 | Thyssenkrupp Testturm | 246m | 232m | $10.08 | $0.04 | £7.95 | £0.03 | Rottweil | Germany | 2017 | 3,18 |
| 67 | Lotte Center Hanoi | 272m | 262m | $9.85 | $0.04 | £7.77 | £0.03 | Hanoi | Vietnam | 2014 | 3,17 |
| 68 | Torre de Collserola | 288m | 136m | $5.60 | $0.04 | £4.42 | £0.03 | Barcelona | Spain | 1992 | 3,15 |
| 69 | Baiyoke Tower II | 328m | 290m | $5.34 | $0.02 | £4.21 | £0.01 | Bangkok | Thailand | 1997 | 3,11 |
| 70 | Fukuoka Tower | 234m | 123m | $7.31 | $0.06 | £5.76 | £0.05 | Fukuoka | Japan | 1989 | 3,06 |
| 71 | Osaka World Trade Center | 256m | 252m | $6.39 | $0.03 | £5.04 | £0.02 | Osaka | Japan | 1995 | 2,29 |
| 72 | Evolution Tower | 246m | 224m | $6.99 | $0.03 | £5.51 | £0.02 | Moscow | Russia | 2015 | 2,24 |
| 73 | Kölner Dom | 157m | 97m | $4.48 | $0.05 | £3.53 | £0.04 | Cologne | Germany | 1880 | 2,01 |
| 74 | Sapphire Tower | 261m | 235m | $2.97 | $0.01 | £2.34 | £0.01 | Istanbul | Turkey | 2010 | 2,00 |
| 75 | Ulmer Münster | 162m | 143m | $5.60 | $0.04 | £4.42 | £0.03 | Ulm | Germany | 1890 | 1,84 |
Methodology
The study uncovered the 100 tallest buildings around the world with observation decks and then selected the 75 that had entrance fees. The price for accessing the highest public platform or observation deck was then identified. All the prices came from the official websites of the attractions.
The 3 factors that contributed to the final score were: Height of the Building, Ticket Price, and Price Per Meter. Each of the 3 factors were assigned a standardized rank from 1 to 10 and then an average was calculated to give the final score.